
By KELLIE KELLY
Guest Columnist
 The Indiana Commission for Higher Education is responsible for developing goals that “provide every Hoosier student the opportunity to obtain a quality degree or credential.” Indiana’s Big Goal is “for 60 percent of working age Hoosiers to have a quality degree or credential by 2025.”
In order to see if Indiana is meeting this goal, the Commission for Higher Education maintains statistics on “post secondary education outcomes.” You can research this data at in.gov/che/college-readiness-reports.
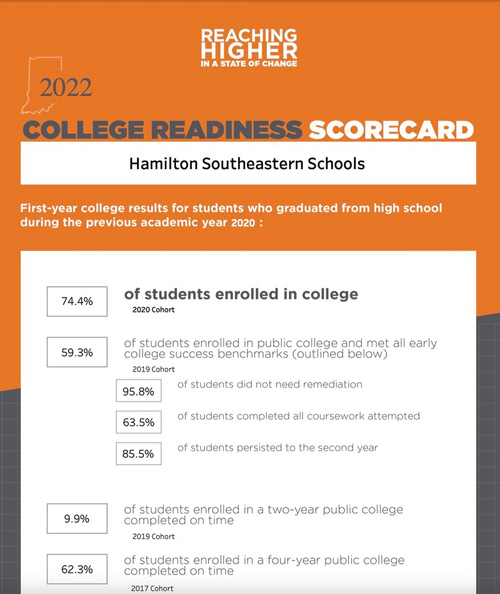
This data is very valuable due to the fact that it has been recorded starting with the high school graduating class, or cohort, of 2008. So, there is a history of data to search for trends. Also, you can easily navigate and view the scorecards for individual school districts in order to see how your particular school district is performing. You can view the Hamilton Southeastern Schools College Readiness Scorecard for 2022 below.
Graphic provided
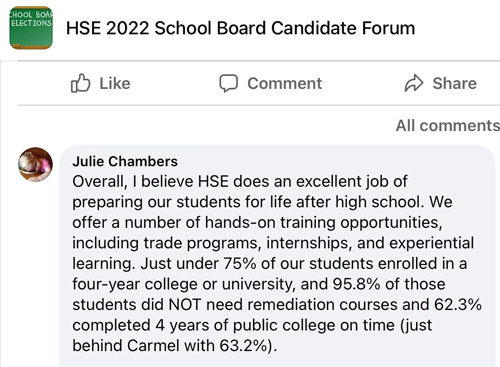
In an online school board candidate forum, Julie Chambers, a candidate running for re-election, made the following comments:
“Overall, I believe HSE does an excellent job of preparing our students for life after high school … Just under 75% of our students enrolled in a four-year college or university, and 95.8% of those students did NOT need remediation courses and 62.3% completed 4 years of public college on time.”
Graphic provided
Let’s look at the statistics from the Commission of Higher Education to fact check this data.
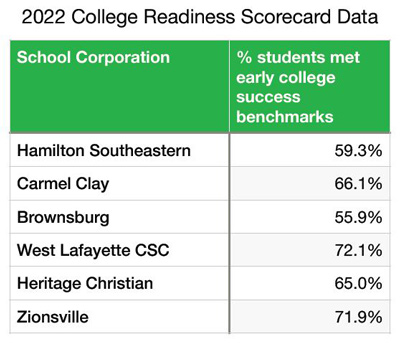
First, let’s discuss the 95.8 percent of students not needing remediation. The Commission of Higher Education looks at three benchmarks to determine early college success: the percentage of students not needing remediation, the percentage of students completing all coursework attempted, and the percentage of students persisting to the second year. They combine these three benchmarks to determine an early college success score. HSE’s early college success score is only 59.3 percent. A table showing early college success scores for neighboring school districts is helpful for comparison to determine if HSE is doing well with this metric. See the table below.
Graphic provided
It is inaccurate for Ms. Chambers to cite only one part of a three-part benchmark in order to make an argument that HSE schools are doing an excellent job. Looking at all three components of the early college success benchmark paints a different picture. Only choosing data to support your argument while ignoring other data is called cherry-picking. Cherry-picking data leads to incorrect analysis and poor decision-making.
Next, let’s look at the percentage of students enrolled in college. Ms. Chambers is correct that just under 75 percent, or 74.4 percent to be exact, of HSE students from the 2020 graduating class are enrolled in college. However, without relating that number to other school district percentages or with other graduating class percentages, there is no way to determine if that is a good or bad statistic.
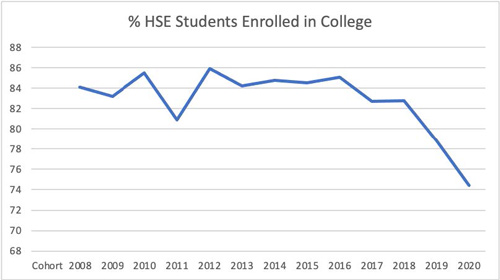
Let’s look at the historical data for Hamilton Southeastern Schools. A line graph below for the percentages of HSE students enrolled in college from the graduating classes of 2008 to 2020 shows a rapid decline. HSE’s greatest percentage of students enrolled in college was 85.9 percent with the graduating class of 2012; 74.4 percent is NOT a percentage which should encourage parents to believe that HSE Schools under the current School Board and Administration are doing a good job to prepare students for life after high school. This is just one more declining statistic along with declining standardized test scores, declining math scores, declining IREAD-3 scores for two of our elementary schools, and now declining percentages of students enrolled in college.
Graphic provided
We need new school board members to refocus our schools on academics, not activism. Vote for candidates who want to put academic excellence back in our schools. With your help we can turn things around in order to see these graphs go up, not down.
What is the historical data for these rates in HSE: percentage of free/reduced eligible students, percentage of special education students, percentage of ELL students, percentage of two parent households, percentage of families who own a home…
My point is, the writer should not be so quick to blame the school board, or by implication, teachers, without giving the full story of the district.
Interesting that this author would proffer accusations of ‘cherry picking’ data & then completely omit the dramatic demographic & population changes that have occurred during the timeline being offered in support of the stated premise.
Activism indeed.
What exactly are Ms. Kelly’s credentials? This analysis seems based on her own interpretation of the data, but she draws a line that isn’t supported by that data. Is she a Data Scientist? Does she have some role in Education policy that would give her some insight? Or is this just an attempt to discredit a school board member for their own agenda? There is too much divisive politics in our district and this is what 4 of the SB candidates are using to try to get elected. I support Julie Chambers as she is the most qualified and has a track record to back it up.
In a previous supposed ‘data analysis’, by the same author, the Brownsburg school system recorded the highest test scores & those scores were offered as conclusive proof that the HSE is in fact underperforming & with the makeup of the school board being the primary culprit.
And yet, in the college readiness example given, HSE scores several percentage points above Brownsburg for that metric.
Obviously there’s more to accurately interpreting data than this author is aware of.
The first law of holes ; “if you find yourself in a hole, stop digging.”
.
To those who keep blaming demographics, https://www.homearea.com/rankings/place-in-in/median_household_income/
Now…. let’s overlay the percentage of kids going to college with the state and national averages. That will help draw a picture of whether it is a local issue or whether it is a trend happening around the country – you know a trends such as kids sitting out because colleges went virtual, or kids stepping back and taking a gap year because college has gotten expensive. The author accuses Julie of cherry picking then totally cherry picks to make her own point. Very biased coverage.